
*Record scratch*
*Freeze frame*
Yup, that’s me being plowed to the ground because the business just lost more than $500,000 with our fraud detection system by wrongly flagging fraudulent transactions as legitimate, and my boss’s career is probably over. And that guy in the chair? That’s our DevOps Engineer. You’re probably wondering how we got here…
My story began with an image that you’ve probably seen over 1,001 times—the lifecycle of an ML project.

A few months ago, we finally deployed to production after months of perfecting our model. “Congratulations!” I told myself and my colleague, “Our hard work has surely paid off, hasn’t it?”. Excitement was immeasurable.
Our model was serving requests in real-time and returning results in batches—good stuff! Surely that was enough, right? Right?
Well, not quite, which we got to realize in a relatively dramatic fashion.
I’m not going to bore you with the cliché reasons why the typical way of deploying working software just doesn’t cut it with machine learning applications. I’m still trying to recover from the bruises that my boss left on me, and the least I can do is help you not end up in a hospital bed after “successful model deployment”, like me.
I’ll tell you all about:
- Why deployment is not the final step for you,
- Why you need to also own and monitor models in production,
- What you should monitor in production and how to monitor it,
- Different monitoring and observability platforms and how to choose them,
- Logging and alerting,
- Challenges and best practices for monitoring your models in production,
- And lots more!
By the end of this article, you should know exactly what to do after deploying your model, including how to monitor your models in production, how to spot problems, how to troubleshoot, and how to approach the “life” of your model beyond monitoring.
Congratulations … But it does not stop at deployment
Take a look at your traditional software application after deployment:

Great, right? You almost don’t have to worry about anything. Based on the software development lifecycle, it should work as expected because you have rigorously tested it and deployed it. In fact, your team may decide on a steady and periodic release of new versions as you mostly upgrade to meet new system requirements or new business needs.
In terms of monitoring your application, you might be worried about system metrics, error rates, traffic volume, app loading times, infrastructure (server counts, load, CPU/GPU usage), things like that. Your application scales to a lot of users, and it works as intended and solves the problem it was built to solve.
That’s conventional software. But now, enter the machine learning world:
Deploying your model was likely a hassle in itself. But now, who’s taking care of what you deployed? The software might have a DevOps team that monitors and maintains the system in production but with machine learning applications, you can’t just hand your deployed models off to the Ops team—in your case, it has to be a shared responsibility.
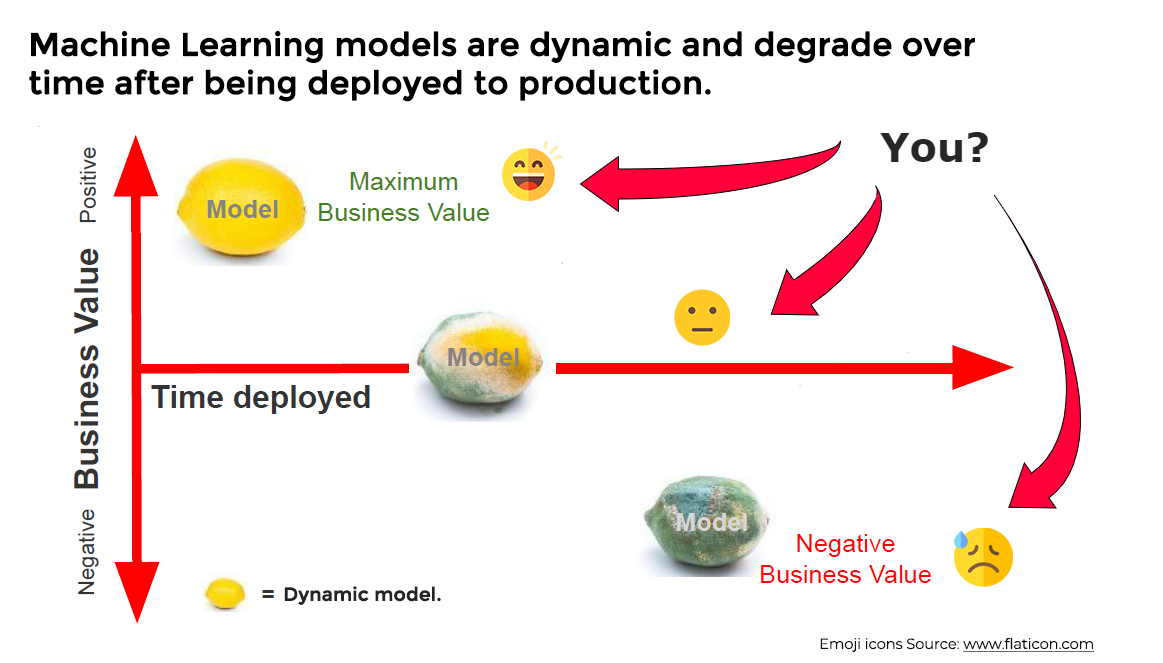
As you can see from the image above, machine learning models degrade over time. They’re dynamic and sensitive to real changes in the real world.
But models are kind of like cars. The value of a new car goes down 10% the moment they’re driven out of a dealership—the moment they’re “deployed” to the real world. Same with your new model.
From the moment you deploy your model to production, it begins to degrade in terms of performance. A model is at its best just before being deployed to production. This is why deployment should not be your final step.
Beyond that, there has to be a way you consistently report back to business stakeholders on whether, and how, your deployed machine learning solution(s) are solving any problems.
Validation results during development will seldom fully justify your model’s performance in production. This is a key reason why you have to monitor your models after deployment—to make sure they keep performing as well as they’re supposed to.
There could also be situations where you deploy models that are localized to multiple geographic regions. How do you ensure that your models serve the intended results (predictions) to each client concerning high interest in their own reality? How do you explain why a model makes certain predictions for one geographic region and a different set of predictions for another region?
Ultimately, the key lesson is this: there’s a lot of work to be done after deployment, and you shouldn’t hand off your models too easily. Deployment isn’t the end of working on your model, it’s actually the beginning!
Why you need to monitor your Machine Learning models in production
If you’ve made it this far, I probably managed to convince you that models perform worse in production than they do in development. This is a challenge you need to be aware of as a data scientist or machine learning engineer. You’ll find the solutions to this challenge in production, and this is where you take the next step after deployment—monitoring!
But why do you need to monitor your models?
To answer this question, let’s look at some of the challenges your model will encounter in production:
|
|
Production Challenge
|
Key Questions
|
|
1 |
Data distribution changes |
Why are there sudden changes in the values of my features? |
|
2 |
Model ownership in production |
Who owns the model in production? The DevOps team? Engineers? Data Scientists? |
|
3 |
Training-serving skew |
Why is the model giving poor results in production despite our rigorous testing and validation attempts during development? |
|
4 |
Model/concept drift |
Why was my model performing well in production and suddenly the performance dipped over time? |
|
5 |
Black box models |
How can I interpret and explain my model’s predictions in line with the business objective and to relevant stakeholders? |
|
6 |
Concerted adversaries |
How can I ensure the security of my model? Is my model being attacked? |
|
7 |
Model readiness |
How will I compare results from a newer version(s) of my model against the in-production version(s)? |
|
8 |
Pipeline health issues |
Why does my training pipeline fail when executed? Why does a retraining job take so long to run? |
|
9 |
Underperforming system |
Why is the latency of my predictive service very high? Why am I getting vastly varying latencies for my different models? |
|
10 |
Cases of extreme events (outliers) |
How will I be able to track the effect and performance of my model in extreme and unplanned situations? |
|
11 |
Data quality issues |
How can I ensure the production data is being processed in the same way as the training data was? |
This should give you a broad idea of the challenges that you may encounter after deploying to prod, and why you need to continue your good work after deployment by monitoring your model(s) in production.
Essentially, the goal of monitoring your models in production is:
- To detect problems with your model and the system serving your model in production before they start to generate negative business value,
- To take action by triaging and troubleshooting models in production or the inputs and systems that enable them,
- To ensure their predictions and results can be explained and reported,
- To ensure the model’s prediction process is transparent to relevant stakeholders for proper governance,
- Finally, to provide a path for maintaining and improving the model in production.
Let’s get more specific.
What to monitor based on challenges your model could encounter in production: Functional monitoring vs operational monitoring
You’ve deployed your model, and now you need to observe and check the progress and quality of your ML application in production over its entire lifetime, keeping it under systematic review so it keeps serving its intended value—this is monitoring in the context of production machine learning systems.
Your machine learning application isn’t just the model, but everything that enables your model in production, including infrastructure, input data, resources, and other upstream and/or downstream services.
If you’re wondering about what to monitor, you should generally think about two things:
- What could go right?
- What could go wrong?
What could go right?
Wondering about what could go right, you should think back to the planning phase of your machine learning project workflow, where you hopefully planned around the user and the business objective.
Primarily, everything that could go right is all that guarantees that the business objective and the user (human/service/system) needs are met.
How do you monitor and measure this? It’s very unique for each business use case, and typically depends on:
- What does your business define as success? What were the KPIs set during the planning phase?
- What were the performance expectations before deploying to production?
- If my model returns a prediction to a client, what does it expect in terms of results and how quickly should it be delivered?
To answer the questions above, you need some metric selection criteria. Success for a business could mean an entire system in which your model only plays a small role.
To hone in and get specific with your metric selection criteria, you can follow some of these best practices (credits to Lina Weichbrodt for this):
- Pick a metric comparable across models,
- Simple and easy to understand,
- Can be collected in real-time,
- Allows for actionable alerting on problems.
To think about what success means for a business, you also have to think about what qualifies as a good user experience. Then think about how your model contributes to that good user experience in the context of the entire system—your model is usually not the main solution to UX issues.
For example, if we’re building a loan approval system, a good business objective could be:
“quickly approving a loan for a customer that will pay back at the stipulated time”
A goal like this would probably result in a good user experience, but it would be difficult to monitor how well our model contributes to it. There are lots of variables that contribute to whether a customer pays back a loan or not (including how they perceive the business, the interest rates offered, and so on). We can’t monitor that.
So, a decent metric to monitor could be:
“How fast does the model score a request from the client and return a prediction?”
With constraints like these:
- Our model should return a prediction (likelihood) score between 0.6 and 0.7 as loans that should come with a very high interest rate to mitigate risk, 0.71 and 0.90 as loans that should come with a mid-level interest rate, and a score > 0.91 as loans that should come with low-interest rates. This is because we can’t get real-time feedback on whether this customer will actually pay (as ground truth to evaluate our model), so we’re going to use the model’s score as the real-time metric to monitor.
- A successful HTTP 200 OK response to the client’s request.
- Latency of ~100 ms latency would be considered a good response time.
- An SLA (service level agreement) of > 95% to a downstream service in a microservice architecture.
In this way, I have picked a metric that:
- Can be compared across models,
- Isn’t too broad nor too specific; it’s simple and easy to understand.
- Can be collected in real-time.
- Allows actionable alerting for issues that may arise in production.
Anything that negates the point above should be considered a “bad” user experience and could be described as everything that could go wrong. Case in point, if the model returns a likelihood score of 0.55 for a loan request, that should either alert someone (maybe a consultant that can take a look at the loan request) or alert a different system to load up another model for scoring.
Now for the fun part—monitoring the things that could go wrong.
What could go wrong?
You can monitor what could go wrong with your machine learning model in production at two levels:
- Functional level monitoring – monitoring model performance, inputs (data), and outputs (predictions).
- Operational level monitoring – monitoring at system and resource level.
Functional monitoring
As a data scientist, you’re primarily responsible for monitoring at this level. You’re mostly monitoring the performance of your model in relation to the inputs, as well as the prediction results and what goes on in the model while learning in production.

Data
Input level functional monitoring is crucial in production because your model reacts to the inputs it receives. If the inputs aren’t what your model expects, it will most likely influence performance. Monitoring and measuring input level challenges is the first step to troubleshooting functional performance issues and solving them before serious damage is done.
Below are the three cases you may want to monitor at the input level.
1. Data quality issues
Data quality (integrity) issues mostly result from changes in the data pipeline. To validate production data integrity before it gets to the model, we have to monitor certain metrics based on data properties. This way, if the input data isn’t what we expect or what we think the model expects, an alert can be triggered for the data team or service owner to take a look.
The primary goal of monitoring here is to flag any data quality issue, either from the client or due to an unhealthy data pipeline, before the data is sent to your model (which would generate unreliable predictions in response).
Some of the trackable causes of data quality issues are:
Preprocessing production data
In some cases, your streaming data pipeline will ingest data from multiple sources. It’s easy for a change in one or more sources to cause a breakage in the data preprocessing step in the pipeline—GIGO (garbage in garbage out), pretty much.
Changes to the source data schema
In other cases, you could encounter situations when valid changes have been made to the data at the source, and preprocessing works just fine but it’s not the sort of input configuration the model was trained on.
For example, a schema change could be the database admin for one of your data sources renaming a feature column and adding another column to catch new data. While this might scale through the preprocessing step, it sure would be a hassle for the model to predict, so it will likely give a partial response as the prediction. The schema change would mean that the model needs to be updated before it can map the relationship between the new feature column and the old ones.
Data loss/corruption at the source
In some other cases, a data pipeline may not be able to ingest data from one source because the data is unavailable, perhaps due to changes in a data source upstream, or data not being recorded. There could be cases where the upstream data source has corrupted or missing features. It’s imperative to monitor issues like these as they will undoubtedly affect the overall performance of your system.
Data quality issue detection techniques
Write tests to detect data quality issues. Some data quality checks include:
- Testing input data for duplicates,
- Testing input data for missing values,
- Catching syntax errors,
- Catching data type and format errors,
- Checking schema for semantic errors in terms of feature names,
- Effective data profiling for complex dependencies in the data pipeline,
- General integrity checks; does the data meet the requirements of downstream services or consumers?
Possible solutions after detecting data quality issues
- Provide an alert following a schema change.
- Ensure proper data validation practices are implemented by data owners.
- Ensure everyone is aware of their role in getting the data to the pipeline and enable effective communication between data owners so that when a change is made at the data source, the model owner(s) and other service owners are aware.
2. Data/feature drift
Monitoring your input is perhaps the most vital aspect of functional monitoring. It could inform you ahead of time about the changing landscape and context around the business case you’re solving. Models aren’t intelligent enough to adjust to a changing world unless they’re constantly retrained and updated.
Data drift refers to a meaningful change in distribution between the training data and production data. Changes in input data distribution will affect model performance over time, although it’s a slower process than in the case of data quality issues.
While it’s possible to monitor this drift at the level of the entire dataset, it is often advisable to monitor it at the feature level.
Feature/attribute drift
Monitoring at the feature level is often the best way to detect issues with input data. Getting this right is very helpful during the analysis stage when you’re seeking explanations for model performance and behavior.
You can monitor feature drift by detecting changes in the statistical properties of each feature value over time. Some of these properties include standard deviation, average, frequency, and so on.
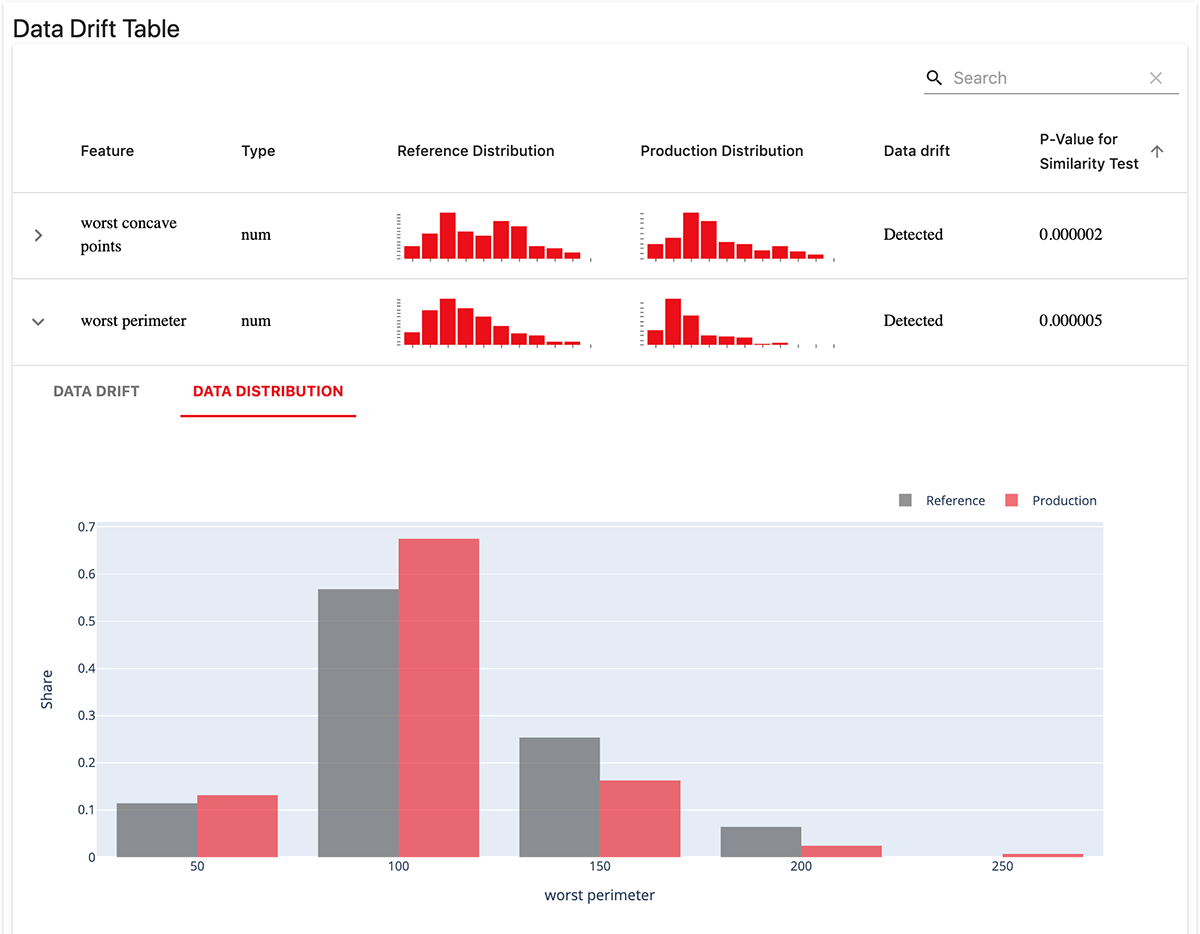
Feature drift can occur due to data quality issues or general changes in the real world, like changes in the preferences of business customers. An example of feature/attribute drift is illustrated below, where a historical set of attributes are used as a baseline and newer attributes are compared so that changes in the distribution of the attributes can be detected.

Oftentimes, the changes that degrade model performance the most are changes made to the most important features that the model uses to “connect the dots” and make predictions. Monitoring input (data) drift closely can give you a heads-up on model drift/model performance before it becomes problematic. When the distribution of the data changes, features drift, or other issues happen with the input, you can be alerted before they start degrading the performance of your model.
Data drift detection techniques
To detect data drift, perform distribution tests by measuring distribution changes using distance metrics:
- Basic statistical metrics you could use to test drift between historical and current features are; mean/average value, standard deviation, minimum and maximum values comparison, and also correlation.
- For continuous features, you can use divergence and distance tests such as Kullback–Leibler divergence, Kolmogorov-Smirnov statistics (widely used), Population Stability Index (PSI), Hellinger distance, and so on.
- For categorical features, chi-squared test, entropy, the cardinality or frequency of the feature.
- Some platforms (such as Fiddler) are now providing out-of-the-box monitoring solutions for outlier detection using machine learning and other unsupervised methods.
- If the features are enormous, as is the case with a lot of datasets, you may want to prune them using dimensionality reduction techniques (such as PCA) and then perform the necessary statistical test.
If you’re looking to learn more about these statistical measures, this white paper by Arize AI provides a conceptual and detailed look into these statistical checks.
Thankfully, most ML monitoring platforms (more in a coming section) provide some of these metrics out-of-the-box so you don’t have to script them yourself.
Possible solutions after Data Drift detection
- The most plausible solution is to trigger an alert and send a notification to the service owner. You might want to use an orchestration tool to kick off a retraining job with production data, and if the distribution change is really large, you might want to build another model with your new data.
- Oftentimes, your new data won’t be large enough for retraining your model or remodeling. So, you could combine and prepare your new data with historical (training) data and then, during retraining, assign higher weights to the features that drifted significantly from each other.
- In other cases, you might be lucky to have your new production data sufficient for the task. In such a case, you can go ahead and build a challenger model(s), deploy it (either offline or online), and test using shadow testing or A/B testing approaches to determine if it’s better than or as good as the champion (current) model in production.
3. Outliers
Monitoring outliers in your input data is crucial, but also very tricky. You’re monitoring extreme and anomalous events that may be one-off events or a group of one-off events. This can inevitably affect model performance, as outliers don’t have sufficient learnable structure across the entire dataset, which will cause the model to return an unreliable response as it won’t quite “connect the dots” from your production data.
Outlier detection
You may not be able to set specific monitors to detect outliers, but what you can do is:
- Use the tests we discussed in the previous section to determine if values and distributions of features are drastically different from normal benchmark periods—very noticeable drifts.
- Perform statistical distance tests on single events or a small number of recent events detecting out-of-distribution issues.
- Analyze if the features your model is most sensitive to—the most important features your model learned after training—have changed drastically.
- Use any of the suitable distribution tests to determine how far off the features (outliers) are from the features in the training set.
- Use unsupervised learning methods to categorize model inputs and predictions, allowing you to discover cohorts of anomalous examples and predictions. Some platforms use AutoML to detect outliers that your test can’t catch.
Possible solutions after outlier detection
- Perform data slicing methods on sub-datasets to check model performance for specific subclasses of predictions. You can automate this process as your model makes and logs predictions to an evaluation store using your monitoring tool.
- If your model keeps performing poorly based on your metrics, you might want to consider evaluating the model at its current state and then training a new challenger model.
- Document the issue and track if this is a seasonal outlier or an extreme, one-off outlier so you can strategize how to go about troubleshooting such problems in the future.
- If the performance of the model can’t be improved after retraining or the new model can’t quite cut it, you might want to consider the model’s performance benchmark and perhaps have a human in the loop, assisting the decision process for that period.

Model
The model is the most important piece to monitor, it’s the heart of your entire system in production. With your model, you monitor its performance in production, components, version, and security threats.
1. Monitoring model drift
Model drift, or concept drift, happens when the relationship between features and/or labels—in cases of supervised or unsupervised learning solutions—no longer holds because the learned relationship/patterns have changed over time. It’s when a model consistently returns unreliable and less accurate results over time compared to benchmarks or business metrics/KPIs.
An example is deploying a sentiment classification model. Over time, people’s sentiment about any topic changes. If you trained your model on positive or negative sentiment with words and certain topics, some sentiments that were tagged as positive may over time evolve to be negative, you can’t rule that out in our extremely opinionated social media world.

Model drift happens because the real-world changes (consequently the ground truth/target the model has been trained to predict)—the answers to business questions are always evolving. What holds today may no longer hold tomorrow, and we’re expected to reflect this fact in our machine learning applications.
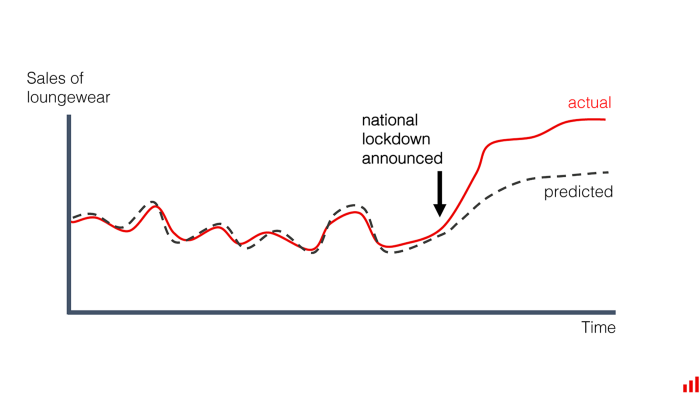
Model drift can be gradual, like when the business climate changes and evolves naturally, and it can also be sudden—as in cases when extreme events suddenly disrupt all operations.
Model drift can happen in different ways
- Instantaneous model drift: Happens when there’s a sudden drop in model performance over time. It could be a bug in the data pipeline causing data quality issues, or the model being deployed in a new domain, or outlier events (like a global crisis).
- Gradual model drift: Most common type of model drift happens as a result of the natural consequences of a dynamic, changing, and evolving business landscape. It could happen as a result of user preferences changing over time, new demographics of customers adopting your product, or newly introduced features that skew the underlying pattern in the data.
- Recurring model drift: This is the result of seasonal events that are periodic and recurring over a year—the pattern is always known and can be forecasted. These could be holidays and yearly discounts. In most cases, user preferences are seasonal or one model serves different regions.
- Temporary model drift: This is quite difficult to detect by rule-based methods and is often detected using unsupervised methods. It happens due to strange, one-off events such as adversarial attacks, users using the product in a way that was not intended, a model temporarily serving newer clients, or system performance issues.
Model drift detection
- You can detect model/concept drift using the same statistical tests as in the case of data drift.
- Monitoring predictive performance (with evaluation metrics) of your model is reduced over time. By setting a predictive metrics threshold, you can confirm if your model consistently returns unreliable results and then analyze the prediction drift (changes in prediction results over time) from there.
- Monitoring data drift can give you a heads-up on whether you should analyze your model for degradations or drifts.
- Monitor label drift (changes in the distribution of real labels, for supervised learning solutions) when you can compare ground truth/actual labels to your model’s prediction to analyze trends and new interpretations of data.
Possible solutions after detecting model/concept drift
- Keep monitoring and retraining deployed models according to your business reality. If your business objectives and environment change frequently, you may want to consider automating your system to schedule and execute retraining at predefined intervals compared to more stable businesses (learn more about retraining here).
- If retraining your models doesn’t improve performance, you may want to consider remodeling or redeveloping models from scratch.
- If you’re working on larger scale projects with a good budget and little trade-off between cost and performance (in terms of how well your model catches up with a very dynamic business climate), you may want to consider online learning algorithms for your project.
2. Model configuration and artifacts
The model configuration file and artifacts contain all the components that were used to build that model, including:
- Training dataset location and version,
- Test dataset location and version,
- Hyperparameters used,
- Default feature values,
- Dependencies and their versions; you want to monitor changes in dependency versions to easily find them for root cause analysis when model failure is caused by dependency changes,
- Environment variables,
- Model type (classification vs regression),
- Model author,
- Target variable name,
- Features to select from the data,
- Code and data for testing scenarios,
- Code for the model and its preprocessing.
Track the configurations for relevance—especially the hyperparameter values used by the model during retraining for any abnormality.
3. Model versions
Monitoring model versions in production are critical if you want to be sure that the right version is deployed.
You can monitor model versions by configuring your retraining pipeline to automatically report model versions after training and log metadata to a metadata store. Version history should be logged to an evaluation store alongside model predictions, this way problems will be easier to tie to model versions.

How to Have Model Development Under Control (Version, Store, Organize, and Query Models)
4. Concerted adversaries
Every business faces security threats. With machine learning applications increasingly becoming the central decision system of most companies, you have to be concerned about the security of your model in production. Most machine learning models are susceptible to adversarial attacks.
This is especially common with machine learning applications in credit risk and financial institutions in general—for example, fraudsters may attempt to fool a model that is tasked with detecting suspicious credit card transactions.
Other applications susceptible to adversarial attacks include:
- media companies adopting AI to detect fake news and other inappropriate content,
- general applications that deal with audio or image recognition.
Concerted adversaries come directly from systems or hackers that intentionally engage your system through adversarial attacks. They mislead the system with adversarial examples so it can provide unreliable results and cause it to make mistakes. Such attacks (which are often anomalous) represent a specific problem in the safety of your machine learning application in production and need to be monitored.
You can monitor your system for adversarial attacks by:
- Using the same steps you use to flag inputs with outlier events because adversarial threats don’t follow a pattern, they’re atypical events.
Possible solutions after detecting concerted adversaries
There’s ongoing research on methods and algorithms that could defend models from adversarial threats, but most of this research is still at an early stage. The solutions to stopping concerted adversaries still require routing detected anomalous events to a human supervisor before predictions are used. Subject matter experts can study these cases and use them to defend the model from further threats.
In business-critical applications, speed matters. How fast experts detect an adversarial threat, study such a threat, patch the vulnerability by retraining the model, and redeploy the model may make all the difference for the business.
The Adversarial Robustness Toolbox (ART) by Trusted AI is worth checking out.
Predictions (Output)
Monitoring model output in production is not just the best indicator of model performance, but it also tells us if business KPIs are being met. In terms of model predictions, the most important thing to monitor is model performance in line with business metrics.
Model evaluation metrics
Using metrics to evaluate model performance is a big part of monitoring your model in production. Different metrics can be used here, such as classification, regression, clustering, reinforcement learning, and so on.
We typically evaluate the model using predefined model scoring metrics (accuracy, AUC, precision, etc) when you have a ground truth/label to compare your model with.
How to Track Machine Learning Model Metrics in Your Projects
Ground truth/actual labels
Your ground truth/actual label is the correct solution to the problem your model tries to solve in the real world.
A basic example would be:
“Will this user click on this ad?”
If a user clicks on the ad, then the actual (label) is yes. An aggregation of the comparison between your model’s predictions (if they clicked on the ad or not) and what the correct solution is can give you an overview of how well your model is doing in production. There’s real-time feedback in this case because your system can tell almost immediately if a user clicked an ad or not. A comparison could look like this:
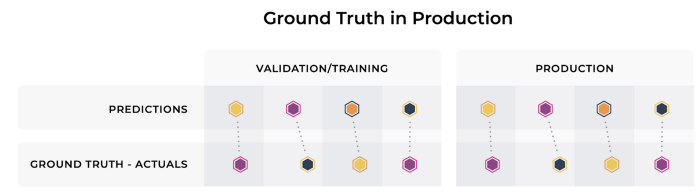
However, comparing actuals to predictions in production is a very difficult task in most cases. Especially if you don’t have dedicated and expert annotators to log the actual labels for you if they’re impossible to get in real-time. For example, a loan approval system wouldn’t give you “correct solutions” in real-time because loan repayment options might take months, even years. This process involves a sophisticated feedback loop for us to be able to measure the performance of our model against real-world expectations.
Sometimes, you might have situations where your ground truth is influenced by your model’s predictions.
For example, if you build a loan approval model to predict which customer will likely repay a loan, your model might perform well by appropriately approving loans for customers that will rightly pay back (that is, agreeing with the ground truth). But how do we know for sure that the customers it didn’t approve wouldn’t have paid you back? Well, the ground truth might not be the most appropriate source of truth on the performance of such a model.
Scoring models when ground truth is available
The most effective way to gauge the functional performance of your model in production is to monitor the prediction of the model and compare it to what’s true in the real world.
To achieve this, model predictions are logged alongside the ground truth collected to give a concrete idea about performance in a production environment. Below is an example of how you can set up a monitoring system that collects ground truth data from various sources or a single source of truth:
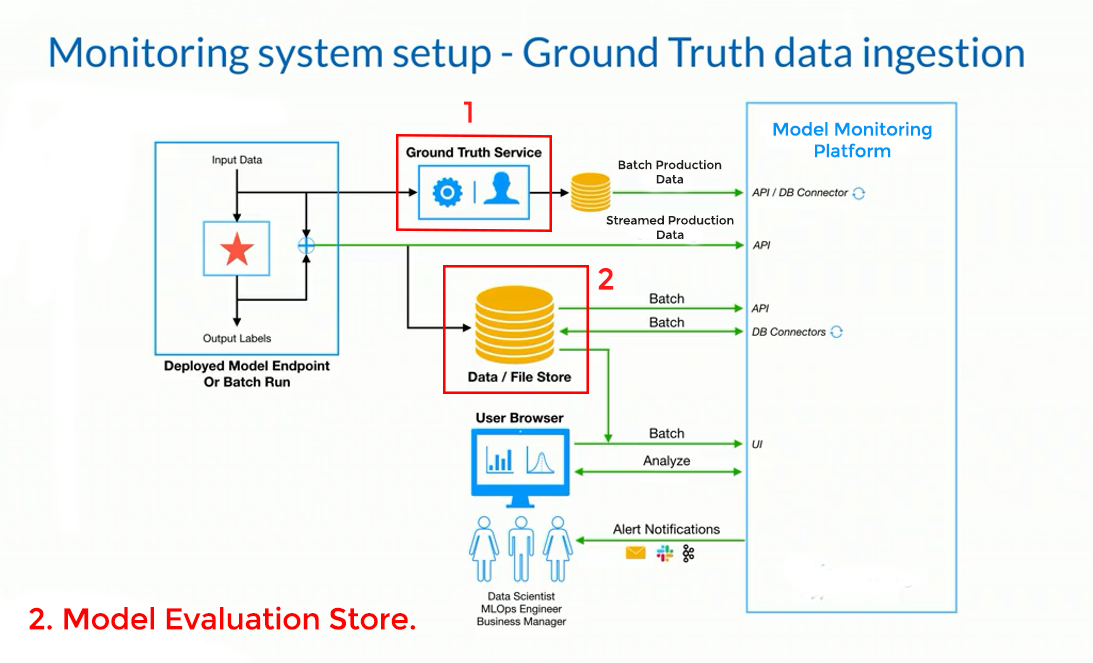
At 1, a part of the production data (input data) is channeled to the ground truth service which typically involves real-time ground truth generated by your system (for example, logging if a user clicked on an ad when the model predicted they would), a human label annotator, or other data labeling vendors for more complicated tasks (such as confirming if a customer repaid a loan at the stipulated time, or confirming if a transaction was fraudulent or legitimate after contacting a customer).
The event id that tracks prediction and model details is tagged with that ground truth event and logged to a data store. The data is then ingested into the monitoring platform, which computes the model performance metric given the model’s prediction and the actual label.
As you probably already know, metrics for a classification model include:
- Accuracy
- Confusion Matrix,
- ROC-AUC Score,
- Precision and Recall Scores,
- F1-Score.
Metrics for a regression model include:
- Root Mean Square Error (RMSE),
- R-Squared and Adjusted R-Square Metrics,
- Mean Absolute Error (MAE),
- Mean Absolute Percentage Error (MAPE).
Calculating the model metrics above is only possible when you have the ground truth available.
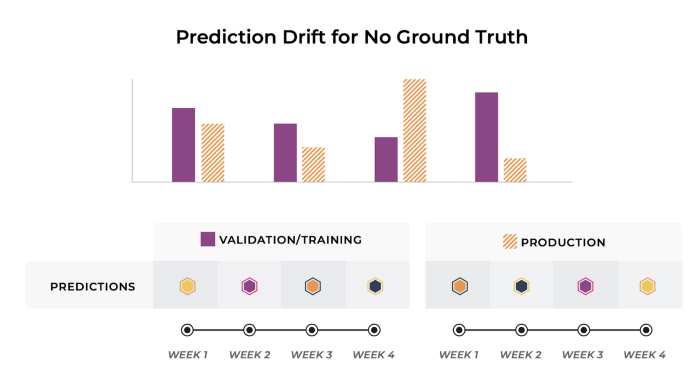
Scoring models when ground truth is NOT available—prediction drift
How about when the ground truth isn’t available or is compromised? We use the prediction results distribution as a performance proxy because that, hopefully, has been set in line with the business KPI.
Hopefully, your monitoring platform is set up in such a way that model predictions are also logged to a model evaluation store. A model evaluation store holds the response of the model (a signature of model decisions) to every piece of input data for every model version, in every environment. This way, you’ll be able to monitor model predictions over time and compare the distribution using statistical metrics such as Hellinger Distance (HDDDM), Kullback-Leibler Divergence, and Population Stability Index (PSI).
There are also other cases for monitoring models in production that you may want to consider. Check out this useful playbook on monitoring model performance in production by Aparna Dhinakaran.
Operational level monitoring
Monitoring at the operations and system level is primarily the responsibility of the IT operations people or the DevOps team. But, it also has to be a shared responsibility between you and the Ops team. When things go bad at this level, alerts are typically forwarded to the Ops team to act on—but you can also opt to get a copy.
At this level, you’re mostly monitoring the resources your model runs on (and runs in) in production and making sure that they’re healthy. Resources such as pipeline health, system performance metrics (I/O, disk utilization, memory and CPU usage, traffic, things that ops people typically care about), and cost.

System performance monitoring for ML models in production
Operationalizing machine learning solutions in production is fundamentally an infrastructure problem. Monitoring model performance and data without monitoring the performance of your ML infrastructure is like building sand castles—your infrastructure is the foundation to a successfully deployed and maintained machine learning solution.
Monitoring your system/application performance can help you answer questions such as:
- Does this application meet uptime requirements?
- Is it serving requests quickly enough?
- Is it efficiently utilizing resources and saving costs?
- How about changes in code dependencies, can it handle it?
- Does it meet scalability requirements?
- What are its serving limitations?
System performance metrics
What we monitor here is influenced by the challenges we expect our model and data to face during the utilization. While this isn’t your primary monitoring concern, you do need to be aware of certain metrics that can give you an indication of how your model performs in line with the entire application stack. If your model has high latency in returning predictions, that is bound to affect the overall speed of the system.
The system/application performance metrics to monitor that will give you an idea of model performance include:
- CPU/GPU utilization when the model is computing predictions on incoming data from each API call; tells you how much your model is consuming per request.
- Memory utilization for when the model caches data or input data is cached in memory for faster I/O performance.
- Number of failed requests by an event/operation.
- Total number of API calls.
- Response time of the model server or prediction service.
Aside
Here’s an example of how Neptune helped ML team at Brainly optimize monitoring and debugging of their ML processes.
 Neptune gives us really good insight into simple data processing jobs that are not even training. We can, for example, monitor the usage of resources and know whether we are using all cores of the machines. And it’s quick – two lines of code, and we have much better visibility. Hubert Bryłkowski, Senior ML Engineer at Brainly

-
Read the full case study with Brainly
-
Watch the product demo
System reliability
Here, we’re monitoring the infrastructure and network uptime. How many clusters are running, which of the machines are running, and everything related to infrastructure. You’re monitoring the number of clusters up and running at any given time, and which of the prediction services (if you have more than one) get the most requests.
This isn’t our primary concern as ML engineers and data scientists, but don’t you want to be aware of the reliability of the entire system that powers your model? It can’t hurt to know these things.
Pipelines
Monitor the health of your data and model pipeline. Unhealthy data pipelines can affect data quality, and your model pipeline leakages or unexpected changes can easily generate negative value.
Data pipelines
Monitoring the health of data pipelines is extremely crucial because data quality issues can arise from bad or unhealthy data pipelines. This especially is extremely tricky to monitor for your IT Ops/DevOps team and may require empowering your data engineering/DataOps team to monitor and troubleshoot issues.
It also has to be a shared responsibility. Work with your DataOps team, communicate what your model expects, and the team will tell you what the output of their data pipeline is—this can help you tighten up your system and drive positive results.
If you’re charged with the responsibility of monitoring your data pipeline, here are some metrics and factors you may want to track:
- Input data – are the data and files in the pipeline with the appropriate structure, schema, and completeness? Are there data validation tests and checks in place so that the team can be alerted in case of an oddity in ingested data? Monitor what comes into the data pipeline to keep it healthy.
- Intermediate workflow steps – are the inputs and outputs of every task and flow in the DAG as expected, in terms of the number of files and file types? How long does a task take to run in the pipeline? This could be the data preprocessing task, or the validation task, or even the data distribution monitoring task.
- Output data – is the output data schema as expected by the machine learning model in terms of features and feature embeddings? What’s the typical file size expected from an output file?
- Data quality metrics – tracking the statistical metrics according to the data that flows in. This could be basic statistical properties of the data such as mean, standard deviation, correlation, and so on, or distance metrics (such as KL divergence, Kolmogorov-Smirnov statistic). The statistical metric used will be mostly dependent on the dimension of data expected; a couple of features or several features.
- Scheduled run time of a job, actual run time, how long it took to run, and the state of the job (successful, or failed job?).
Model pipeline
You want to track crucial factors that can cause your model to break in production after retraining and being redeployed. This includes:
- Dependencies – you don’t want a situation where your model was built with Tensorflow 2.0 and a recent dependency update by someone else on your team that’s bundled with Tensorflow 2.4 causes part of your retraining script to fail. Validate the versions of each dependency your model runs on and log that as your pipeline metadata, so dependency updates that cause failure can be easier to debug.
- The actual time a retraining job was triggered, how long it took the retraining job to run, resources usage of the job, and the state of the job (successfully retrained and redeployed model, or failed?).
Cost
You need to keep an eye out for how much it’s costing you and your organization to host your entire machine learning application, including data storage and compute costs, retraining, or other types of orchestrated jobs. These costs can add up fast, especially if they’re not being tracked. Also, it takes computational power for your models to make predictions for every request, so you also need to track inference costs.
Your application may be hosted at cloud vendors such as AWS or Google Cloud. These vendors track your bills and how much each service is costing you and enable you to set budgets and send alerts if those budgets have been maxed. For an on-premise system, monitoring system usage and cost can help you analyze what part of the application is most costly, and see what compromises (or not) can be made.
Another metric you might want to consider monitoring is service level agreements (SLAs) in your application. The prediction service may have a set SLA with the data pipeline or the service that queries it. Make sure to set a threshold to trigger an alert when the SLA is not met.
We’ve covered a lot of things you might want to consider monitoring and it’s quite overwhelming, isn’t it? In the next section, you’ll learn what to monitor at your current MLOps maturity level and this will give you an actionable idea of where to get started.
Sidebar: Monitoring vs observability in production Machine Learning systems
If you have a DevOps background, you may know that monitoring a system and observing the same system are two different approaches.
Observability is your ability to look at the metrics you’ve been monitoring and perform root-cause analysis on them to understand why they are a certain way, and what threat they pose to the overall performance of your system—all to improve system quality.
Monitoring is pretty much everything that happens before observability:
- Collecting performance metrics,
- tracking them,
- detecting potential problems,
- alerting the right user.
To put it simply, you can monitor without observing, but can’t observe your system’s overall performance without monitoring it. Monitoring is about collecting the dots, observability is about connecting them!
If you want to learn more about observability and monitoring for machine learning production systems, check out Christopher’s article.
How to get started monitoring your Machine Learning models in production
Your next quest is to start monitoring your models after you deploy them. Below is a visual illustration of the step-by-step approach you should take, now that you know why you need to monitor and what you need to monitor.

1. Needs analysis: What to monitor based on your MLOps maturity level
There’s a relatively large number of things to track and by different users, which makes monitoring a model in production a sophisticated process. We need tools and platforms to make things easier. What are the right tools and platforms and how can I know when I see one?
Here’s the thing—ML monitoring is a constantly evolving landscape. I can guarantee you that there are no universally good tools, only tools best suited for your particular needs.
Laying out requirements and figuring out what your needs are upfront can be very tricky, so I figured it might be made simpler by meeting you at your MLOps “maturity stage” as highlighted in this Google Cloud blog post. I also summarized this with an illustration in the “Bringing Them All Together…” section.
You are currently at level 0 in your MLOps maturity stage
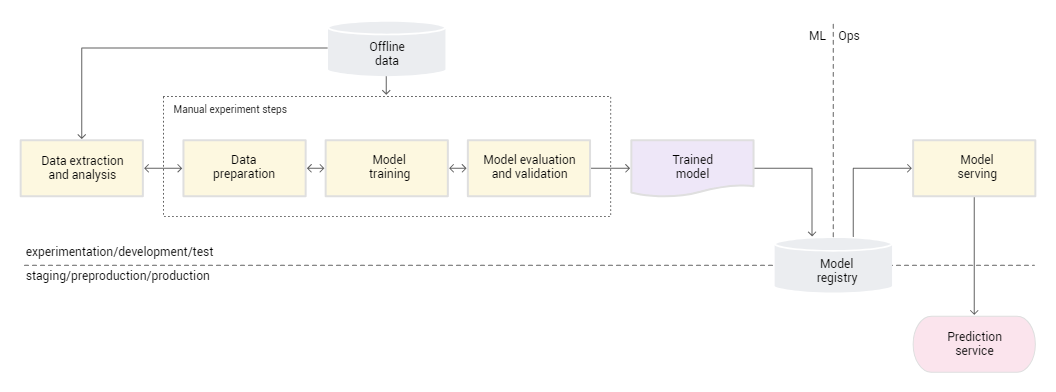
Being at this level means that you’re training and deploying models manually. At this stage, you probably aren’t even thinking of monitoring your model yet, perhaps just finding a way to validate your model on the test set and hand it off to your IT Ops or software developers to deploy.
I know because I was there. I celebrated when I handed it off, as mentioned at the beginning of this article, but as you know—a couple of months later—it has indeed ended in tears and on the hospital bed.
For you to avoid this scenario, I propose you prioritize the lowest hanging fruit. Although less informative, and won’t help you monitor model performance, it can still serve as a reasonable performance proxy to tell you if your general application is working as intended.
You don’t want to spend long hours focusing on monitoring your model’s metrics or try to justify its performance in line with a business KPI when your workflow is still in its manual deployment stage; such metrics will get easier to measure and analyze when your MLOps system gets mature, and you can collect ground truth labels or integrate other performance proxies in the absence of ground truth.
You are currently at level 1 in your MLOps maturity stage

Being at this level means that you have automated the machine learning pipeline to enable continuous training of your machine learning models based on triggers that have been set by criteria or a defined threshold.
At this stage, I reckon you focus more on monitoring:
- The business metric used to gauge your model’s performance (see “What Could Go Right” section)—if it doesn’t turn out to be pretty difficult to measure, especially if you can’t spend them on getting ground truth for monitoring model metrics.
- The properties of your production data and your model’s performance in production to detect model staleness and degradation; can help with continuous training through triggers that automate the ML production pipelines to retrain models with new production data.
- Your model’s retraining process needs to log pipeline metadata, model configuration, and model metadata because you’re most likely going to manually deploy a retrained model, and you want to make sure you can monitor the properties of that model before redeploying it to production.
- You also need to monitor your production pipeline health as retraining steps are automated, and your data pipeline validates and preprocesses data from one or more sources.
- You should also start monitoring how much your continuous training process is incurring so you don’t wake up with a gigantic AWS bill one day that you or your company did not plan for.
You are currently at level 2 in your MLOps maturity stage

Being at this level indicates that you’re completely mature in your MLOps implementation and pretty much the entire pipeline is a robust, automated CI/CD system. Your training, validation, and deployment phases are all automated in a complimentary feedback loop.
At this stage, you should pretty much monitor everything but your team’s focus should be on the more informative metrics, making sure that all the relevant stakeholders are empowered with the more informative metrics before spending more time on the least informative metrics.
Bringing them all together…
Below is a visual illustration of what I reckon you should focus on monitoring depending on the maturity of your MLOps workflow.

While this isn’t a hard and fast rule and can take a bit of brainstorming to figure out with your team, the way I think of it is for you to ask some questions:
- What do we want from an MLOps monitoring platform or tool?
- What are the most important metrics to us at this time?
- What kind of insights do you want to derive? Are these insights directly in line with improving the performance of our entire application to ensure continuous positive business value?
- What’s 20% of the effort we can put in right now to get 80% of the result? 80%, in this case, is positive business value.
- What is our existing ecosystem of tools? Do we have a dedicated team of ITOps/DevOps engineers?
- How easy is it for an MLOps monitoring solution to integrate with the existing software deployment ecosystem?
Oftentimes, these are difficult to think through at a go, but they have to be done and constantly re-evaluated. I reckon you start with the question “What’s 20% of effort we can put in right now to get 80% of the result?”.
Once you can effectively document the answer to the above question with your team, tracking the necessary metrics is hard enough—you should start with a simple solution. Or at least a solution that helps you use fewer tools to monitor your most important metrics. Then you can iterate as you learn about the tools and your needs, adding richer tools if you need them and knowing how to use them.
Surveying existing ecosystem of tools
You know what to monitor based on your MLOps maturity level. If available, you might want to survey your organization for existing tools that your Ops/Engineering team uses to monitor deployed applications.
For example, you might be in an organization where your Ops team already uses Prometheus and Grafana for monitoring system performance and other metrics. That’s probably good news for you as you may not have to worry too much about looking for a platform, you just set up and define your metrics, and/or write test cases for your model and data.
This is rarely the case, regardless. Oftentimes, you may have to be the one to set out and look for a platform that can help you monitor the metrics you need based on your needs analysis.
Be sure to survey your company, understand engineering and Ops culture (talk to the Ops team if you have one!), the tooling, and possible ecosystem integrations before you set out to find a platform that will be suitable for your needs.
Choosing a monitoring/observability platform
Choosing an observability platform can be very tricky, and you have to get it right. There’s a lot of costs, security concerns in terms of data, and other challenges.
Thankfully, it can be simplified by:
- Understanding your monitoring needs, which you probably do by this point in the article.
- Knowing what you have available; survey your organization AND the budget on the ground for you to work with. Some platforms can be quite pricey with features that you don’t need, and there are also open-source solutions available.
- Taking into account the necessary qualities and observability platform that ML should have.
Considerations to make before choosing a monitoring/observability platform
For now, principles that have long worked for monitoring and observing software in production are being adopted for monitoring data and machine learning models in production.
Some platforms are mostly suited for monitoring and observing data quality (such as Monte Carlo and Anomalo) in production while others (such as superwise.ai and Arize AI) are general (production) machine learning observability platforms.

Below is an example Neptune dashboard that tracks some notable performance metrics of an application:
Your ML monitoring/observability platform should:
- Be easy and intuitive to use, configurable by an individual service owner (you!) instead of a central ops team; putting a model to production is hard enough, don’t make things harder for yourself.
- Have out-of-the-box metrics, providing smart defaults for metrics on your registered model.
- Have out-of-the-box and flexible integrations: Make sure platforms can integrate your production data with their systems through DB (database) connectors, API, file transfer, and generally be able to integrate data—whether batch or streaming—from any data source.
- Have out-of-the-box visualization and dashboard: provide smartly prepopulated dashboards and graphs that visualize your metrics. You should also be able to add new panels, create visualizations with the necessary information, and create custom queries depending on your need.
- Have flexible access: Some platforms offer you both programmatic access and access through a management console or user interface.
- Be customizable: You should be able to define your metrics, write your test cases and checks, create custom dashboards and visualizations, custom checks and plugins, set custom thresholds, and generally set up custom integrations and workflow.
- Be collaborative: This isn’t a one-person job like others you may have seen. You should be able to share data, dashboards, and reports widely with relevant stakeholders and service owners. The platform should be able to empower each concerned stakeholder with insights and alerts on how best they can continue to provide positive business value based on our model predictions.
- Have model explainability features: Some tools can help you explain model decisions by testing on a particular segment using methods like data slicing.
- Be able to test model predictions to detect bias and threats (for example, adversarial attacks).
- Be environment- and language-agnostic: You want a platform that can work regardless of what technology you used in building your model or what environment it’s running on in production.
- Be extensible to other platforms and easily integrate with an existing organization ecosystem.
- Be able to auto-detect outliers: Platforms are beginning to use AutoML and unsupervised methods to detect anomalies in input data.
- Have Cloud and/or on-premise deployment solutions: Most of the platforms offer either SaaS-based services or on-premise solutions. Even better, some offer both!
- Be production-grade: Production is a very hard place, especially for models. You don’t want a situation where the platform you choose cannot keep up with monitoring models that make thousands to even millions of predictions per second—essentially, think about the platform’s scalability.
- Granular point of view: The platform/tool should be able to provide you with a granular look at your data and model performance. For example; with this tool, can you drill into each feature in your production data to detect problems and drifts at the feature level? Can you monitor metrics (or an aggregate of the metrics) per second, per hour, per day, per month, and even per year? This will ensure flexibility irrespective of the use case (real-time or batch) that you’re monitoring.
- Perform log auditing: Audit logs from models, data, pipelines, and other system logs, for proper auditing and lineage traceability.
As you have seen, picking one tool requires thorough analysis. Below are some tools I have seen that tick all or most of the boxes above. If you want to learn more about some of the tools and deployment platforms you can choose, Dr. Ori Cohen has already explained most of them in this article and I urge you to take a look at them:
- Arize AI,
- Superwise.ai,
- Prometheus + Grafana,
- Kibana and the ELK stack,
- Whylabs.ai,
- Fiddler,
- Seldon,
- And so on; see more here.
Other challenges you might encounter when monitoring Machine Learning systems in production
Challenges monitoring at input level
Some of the challenges you might encounter in production while monitoring your input data include:
- Your data sources in production may be scattered and unreliable and as a result, it might be very difficult to unify them into a single source of truth or data mesh depending on your data architecture.
- You do not have clear data requirements in terms of what the data structure and schema should be, or what an acceptable service level agreement (SLA) is for the upstream data source.
- Your data sources don’t have defined ownership and this could cause cross-functional miscommunication between teams, especially if someone makes an update to a data source (say a schema change to a DB) and doesn’t inform others.
- Metadata for your production data workflow is not discoverable and as a result, tracking data lineage becomes very difficult. Logging events as well; you wouldn’t know the producer and consumer of the data in question making tracking, troubleshooting, and maintenance difficult.
Some of these challenges aren’t just architectural but they can be cultural too. If data is a product, then:
- People own the “product” (in this case, our data!) and are assigned specific roles,
- Team members communicate with each other the state of their data source,
- They document them through metadata logging,
- Everyone seeing that data is accessed and utilized effectively can go a long way in solving cultural issues.
If you’re curious, you can learn more about “data as a product” thinking here.
Some challenges when monitoring model quality
Some of the challenges you might encounter in production while monitoring your input data include:
- Ground truth availability; you will most likely encounter cases where you don’t have real-time ground truth collection and might have to rely on upstream systems or even human annotators to collect actual labels.
- Model biases that stem from algorithmic biases or dataset biases or sometimes both.
- Black box models where predictions are unexplainable and could cause compliance issues.
- Not tracking model metadata in production for lineage traceability. This one doesn’t have to be an issue when you use a metadata store like neptune.ai— single place to manage all metadata.
A solution you can use is to perform data slicing to analyze segments of your model’s predictions and test for bias. Some tools can automatically do this for you. Some biases peculiar to the dataset can also be prevented and/or eliminated through production data validation test cases. Biases peculiar to the model can be detected through the model metadata and/or metrics.
PRO-TIP: You may also want to take a look at Google’s new web-based data exploration tool Know Your Data which, according to them, helps researchers, engineers, product teams, and decision-makers understand datasets to improve data quality, and helping mitigate fairness and bias issues.
Best practices for monitoring Machine Learning models in production
It should be clear at this point, there’s a lot of work still to be done beyond deploying your model(s) to production.
This will help you understand if your model is performing as expected and solving the problem, or if it needs to be retrained, a challenger model is deployed, or if you need to redefine what good business performance looks like. Below are some best practices I recommend you begin with.

General monitoring best practices
- Focus on people first. If you build a culture where data is also treated as the product in your organization, people will most likely be inclined to take ownership of the product to ensure it serves its intended purpose end-to-end. You can learn a lot from DevOps cultural change.
- If it’s possible, don’t give the application’s “monitoring power” to one person. If you have a cross-functional team of data professionals and Ops engineers, let everyone handle their service and communicate effectively. This will help decentralize knowledge and know-how and when the use cases scale, no one will be overwhelmed.
- Take a lean approach; using too many tools can be very tasking. Centralize your tools but decentralize the team; everyone staying on top of a task.
- Monitoring doesn’t start after deployment, it starts when you begin experimentation. Build a culture of monitoring right from the model development stage (monitoring model experimentation metrics, logs, and so on).
- Always consider what’s optimal for the productivity of your team when you encounter any crucial decision-making point.
- Encourage your team to properly document their troubleshooting framework and create a framework for going from alerting to action to troubleshooting for effective model maintenance.
Best practices for data monitoring
- Batch and streaming data should be processed in the same manner, using the same pipeline so that issues with the data pipeline are a lot more intuitive to troubleshoot.
- Ensure you go beyond checking for the drift for an entire dataset and look gradually at the feature drift as that can provide more insights.
- Invest in a global data catalog that can help log high-quality metadata for your data that every user (your data and ML team) can rely on; it will help you tackle challenges with streaming and maintaining reliable data quality. It will also make lineage tracking easier.
- Perform a pre-launch validation on your evaluation set before moving your model to production to establish a baseline performance.
Best practices for model monitoring
- Model performance will inevitably degrade over time, but beware of a big dip in performance which is often indicative of something wrong—you can select tools that detect this automatically.
- Perform shadow deployment and testing with the challenger model vs the champion model and log the predictions so that performance on the new model can be tracked alongside the current model in production; before you decide to deploy the newly trained (challenger) model.
- You can use a metadata store (like neptune.ai) to store hyperparameters for models that have been versioned and retrained in production; this improves auditing, compliance, lineage traceability, and troubleshooting.
Best practices for monitoring predictions/output
- Prediction drift can be a good performance proxy for model metrics, especially when ground truth isn’t available to collect, but it shouldn’t be used as the sole metric.
- Track unreasonable outputs from your model. For example, your classification model predicting the wrong class for a set of inputs with a high confidence score, or your regression model predicting a negative score (when the base metric score should be 0) for a given set of features.
Sidebar: Setting alerts the right way
Alerting is a crucial part of monitoring. If you track your metrics but aren’t notified when something goes wrong, why even track them? You definitely want to be notified when something goes wrong.
Inevitably, different things with varying degrees of priority will go wrong. How do you separate the wheat from the chaff? Some tools offer out-of-the-box and smart alerting features but oftentimes, it will boil down to what makes sense to a particular business, based on that application.
Setting up alerts the proper way
The best set of advice I got on actionable alerts is from Ernest Mueller and Peco Karayanev in one of their DevOps courses;
- Test your alerts before they go into production
For example, in the case of data drift, write test cases that simulate the statistical metrics you’re using to monitor distribution changes between a development (validation) dataset and the production data you’re simulating. Some platforms (like Domino) automatically apply these statistical checks for you so all you have to do is to register your development data and integrate the production data you’re using for simulation. Select a particular statistical check and set a threshold.

- Monitor the primary metrics as concluded in your needs analysis.
- Agree on the media for the alert, so every service owner is comfortable with their medium. Slack? PagerDuty? Information radiators? Other team chats? E-mails?
- Send context to the alert by including descriptive information and action by the primary service owner.
- Make sure to set up a feedback loop that makes your monitoring better. In the case of data drift that has triggered an alert because it’s greater than a set threshold, you might want to use a pipeline orchestration tool like Apache Airflow to kick-off retraining if data is automatically being logged. Or, the team might have to manually retrain on new data, or entirely remodel the problem off the new data.
Best practices for alerting
- Ensure you and your team are clear on who gets what alert. If possible, data quality alerts should go mainly to the dataops/data engineering team, model quality alerts to the ML team or data scientist, and system performance alerts to the IT ops team.
- Only set alerts when you know there’s a condition that requires intervention. For example, set an agreed threshold for data quality and alerts should only be triggered when that threshold condition is not met.
- Understand what has real business impact and alert for those only, not just anything that goes wrong with the application.
- Indulge the team to characterize alerts they get (whether they were false positives, negatives, or true positives), document the actions they took as well as the outcomes.
- Essentially, you want to avoid “alert hell”; a flurry of irrelevant alerts that may have you losing track of the real, business-impacting alert in the noise.
The best tools will also help you manage your alerts properly, so be on the lookout for this feature!
Sidebar: Why you should log everything!
What if I told you that you could save a lot of time putting out a fire outbreak with your machine learning application in production by just knowing where the source of the fire is?
Enter—logging! In most cases, log monitoring can give you a massive head start in troubleshooting problems with any component of your entire system in production.
So why should you log?
Simple—because you want to make sure you can put out the fire easily when push comes to shove, identify the source of the fire, and take measures to prevent further fire outbreaks in the future.
Interpreting that in machine learning speak—you log because you want to be able to troubleshoot problems effectively by quickly identifying the cause or potential cause, taking the necessary measures to solve such problems, and patching that loophole in your system (or at least keeping it in check).
One more thing, you log for auditing and compliance! Being able to log your data and model events will help create data and model lineage that can be traced and audited for compliance requirements and standards by the relevant stakeholders.
So what should you log?
While it’s fancy to log every activity of every component in your system (from data to model to application and everything else), the volume will always end up being a problem. By volume, I mean storage and the resources that will be used to host and process the log files generated in the process.
Be very strategic about what you log. You probably don’t have the budget to log every activity of every component of your system. You should only log real problems—not everything. Essentially, what you log should have a somewhat consequential impact on the business value your application is serving.
Some of the objects for the data and model components you should log include:
- Data pipeline events,
- Production data (if possible, include the metadata alongside),
- Model metadata; this includes the model version and configuration details,
- Prediction results from the model,
- Prediction results from shadow tests (challenger models); if applicable to your system,
- Ground truth label (if available),
- General operational performance (that is typical to standard monitoring systems).
The most important thing to note is to keep a close eye on the volume. Logged files can grow up to gigabytes and take resources to host and parse, so you want to make sure that it’s included in the budget you set out with at the beginning.
Also, take into account what will cost more—regulator charge for not being able to audit your system for compliance requirements, or the amount of storage and resources logging the necessary objects will take.
Some useful logging tools include neptune.ai, New Relic, Honeycomb.io, and Datadog.
Best practices for logging
- For your pipeline, you should be logging runs from scheduled time to start time, end time, job failure errors, the number of runs; all to make an unhealthy pipeline easier to troubleshoot.
- For your models, you should be logging the predictions alongside the ground truth (if available), a unique identifier for predictions (prediction_id), details on a prediction call, the model metadata (version, name, hyperparameters, signature), the time the model was deployed to production.
- For your application, you should be logging the number of requests served by the champion model in production, average latency for every serving.
- For your data, log the version of every preprocessed data for each pipeline run that was successful so that they can meet audited and their lineage can be traced.
- For storing the structure of your logs, consider using a JSON format with an actual structure so they can be easily parsed and searched.
- Consider rotating log files for better management; delete old and unnecessary logs that you’re sure you won’t need again for auditing or other reasons.
- According to Ernest Mueller, the best logs are formatted, have good time stamps and severity levels, and provide plenty of context to a user.
Oh! It doesn’t stop at monitoring, either? 🙁
There’s a reason you deployed your model to production and there’s a reason you continuously monitor it there—to continue providing positive business value.
Do you know what negative business value is? When regulators or your customers demand to know how your system comes up with decisions and you can’t provide it, you’re canceled, customers churn, or worse, you’re fined a hefty amount by regulators (just ask Goldman Sachs!).
Or when your recommendation system serves the same recommendation to all users for 30 days straight (real-life incident here).
For monitoring to be truly complete, you need to:
- Continuously manage the model in production to make sure it doesn’t slope towards negative business value,
- Make sure the decision-making process of the model can be governed, audited, and explained.
Here’s a great tutorial for learning more about model management in production.
Getting practical through a live sandbox
We’ve covered a lot of practical concepts in this article, it’s time to put that into great use by checking out, working with, and/or configuring a monitoring solution of your own.
- Try ML Monitoring With A SaaS Solution: Whylabs.ai offers a nice live sandbox you can use to check monitor metrics from events like data drift, track model performance, see alerts on data quality issues, and so on.
- Try Hosting Your Solutions: If you want to use an open-source solution, Prometheus + Grafana is perhaps your best bet! Here’s a good practical tutorial on how to monitor your containerized and served model (using FastAPI) with Prometheus and Grafana.
- If you want to get a practical understanding of how a company approaches Machine Learning monitoring and observability, you can check out DoorDash’s great article here.
Conclusion
Yup! Monitoring is something I didn’t do, which is how I ended up with the DevOps guy trying to NOT get involved in all the insanity.
I hope you gained a couple of useful tips on how to monitor your machine learning models in production—and not end up like me! I hope you were able to understand why deployment is never the final step, and you now have enough clarity on where to start in terms of monitoring your models in production.
To conclude this article, I would like to give solutions to the challenges from an earlier section below:
|
|
Production Challenge
|
Key Questions
|
Solutions
|
|
1 |
Data distribution changes |
Why are there sudden changes in the values of my features? |
Use statistical checks to detect data drift |
|
2 |
Model Ownership in Production |
Who owns the model in production? The DevOps team? Engineers? Data Scientists? |
Model ownership in production is a shared responsibility |
|
3 |
Training-Serving Skew |
Why is the model giving poor results in production despite our rigorous testing and validation attempts during development? |
Ensure your production data is not vastly different from your training data, and your production and training data are processed the same way. |
|
4 |
Model/Concept drift |
Why was my model performing well in production and suddenly the performance dipped over time? |
Retrain model on new data or develop another model on new data, if the former does not work. |
|
5 |
Black box models |
How can I interpret and explain my model’s predictions in line with the business objective and to relevant stakeholders? |
View segments of model predictions for explainability. |
|
6 |
Concerted adversaries |
How can I ensure the security of my model? Is my model being attacked? |
Use unsupervised learning methods for outlier detection, including statistical checks, protect your system from security threats. |
|
7 |
Model Readiness |
How will I compare results from a newer version(s) of my model against the in-production version(s)? |
Use shadow testing for testing challenger (newly trained) model vs champion model (model currently in production. |
|
8 |
Pipeline health issues |
Why does my training pipeline fail when executed? Why does a retraining job take so long to run? |
Use logs to audit errors and alerts to inform the service owner. |
|
9 |
Underperforming system |
Why is the latency of my predictive service very high? Why am I getting vastly varying latencies for my different models? |
Use logs to audit the various services for those that are not meeting required SLAs. |
|
10 |
Cases of extreme events (Outliers) |
How will I be able to track the effect and performance of my model in extreme and unplanned situations? |
Understand it is an instantons or temporary drift before taking action. |
|
11 |
Data Quality Issues |
How can I ensure the production data is being processed in the same way as the training data was? |
Write data integrity test and perform data quality checks. |
Happy monitoring!

References and other resources on ML monitoring in production
- The “Production Challenges” concept was adapted from the amazing Aparna Dhinakaran. A big shoutout to her.
- https://en.oxforddictionaries.com/definition/monitor
- 8 Things to Monitor During a Software Deployment – Stackify
- ML Infrastructure Tools — ML Observability | by Aparna Dhinakaran
- Domain-Specific Machine Learning Monitoring | by Lina Weichbrodt | MLOps.community | Medium
- WhyLabs Platform (whylabsapp.com)
- Arize Platform
- The Playbook to Monitor Your Model’s Performance in Production | by Aparna Dhinakaran
- A Machine Learning Model Monitoring Checklist: 7 Things to Track – KDnuggets
- AI in the Time of Corona. How to Build Resilience in Production… | by Aparna Dhinakaran
- Monitoring Models at Scale with Domino (brighttalk.com)
- (659) DevOps Metrics | DevOps Dashboard | DevOps Tutorial For Beginners | DevOps Tutorial | Simplilearn – YouTube
- Monitor! Stop Being A Blind Data-Scientist. | by Ori Cohen | Towards Data Science
- Observability for Data Engineering – KDnuggets
- Lecture 11: Deployment & Monitoring
- Beyond Monitoring: The Rise of Observability | by Arize AI
- Choosing the Right Monitoring Tools for a Full-Stack Solution – DevOps.com
